Mich. Ed. Update – April 17
Another Take on NAEP
This excerpt is from a blog post by Matthew M. Chingos and Kristin Blagg on April 10, 2018. The full text of the post is available here.
NAEP is the only common test of student performance administered across the nation, but states differ widely in the students that they serve. The child poverty rate ranges from 8 percent in New Hampshire to 30 percent in New Mexico. The share of students who are English language learners ranges from 1 percent in West Virginia to 22 percent in California.
This means that each state’s score on the NAEP tells us something about both the students enrolled and the performance of the school system. But policymakers and researchers are often more interested in the latter, which requires making an adjustment for the former.
The NAEP data interactive we created with our colleagues at the Urban Institute does precisely that.
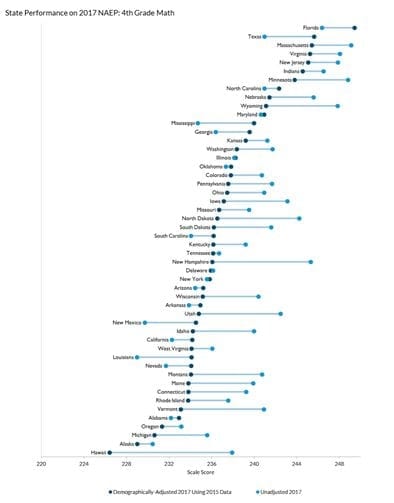
Despite some drawbacks, demographically-adjusted data provide important insights into differences in state-level school performance, and show that there are substantial differences across states, even after adjusting for demographics.
The views expressed here are the authors and may not reflect the views of The Education Trust-Midwest.
Capital Update
The Senate Education Committee will meet today at noon in Room 1300 of the Binsfeld Building. The agenda will include a discussion of Senate Bill 888 (Proos – R) which prohibits the participation of certain public school employees in the retirement system.
Noteworthy News
- Our Editorial: Detroit students lag country, again – The Detroit News
- What the shortage of school counselors means for high school students in Michigan – Stateside Staff, Michigan Radio
- Michigan to focus on improving test scores and skilled trades education – Cheyna Roth, Interlochen Public Radio
Tweet of the Week


