The Education Trust-Midwest (ETM), in partnership with The Education Trust, conducted extensive modeling to identify more equitable formulas that could replace Michigan’s standard, inequitable approach to budget cuts (uniform dollar cuts). To determine if an approach was more equitable, ETM looked at its impact on high-poverty districts in particular.
Key results from our modeling are presented below. The models use financial data from the 2019-20 school year (FY20 budget) and are based on a total cut that would equate to about a $470 dollar cut per pupil under Michigan’s Standard Approach to budget cuts. The magnitude of this cut was chosen because $470 was the highest single-year, per-pupil cut in Michigan’s recent policy history.
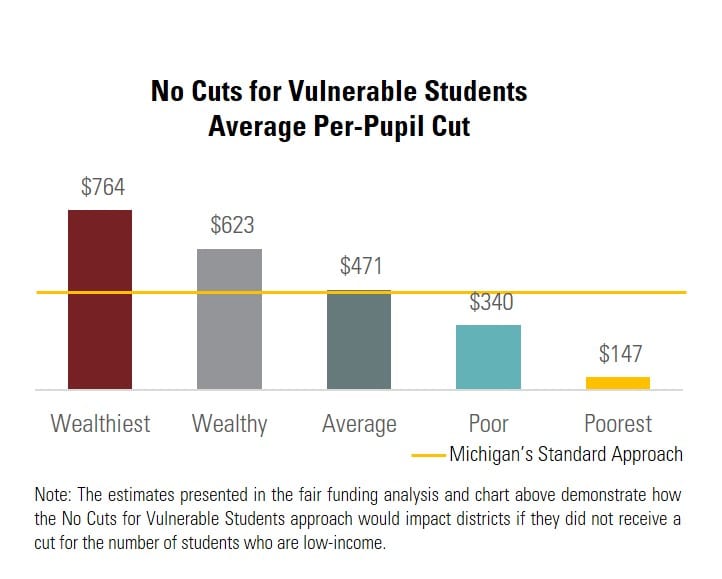
No Cuts for Vulnerable Students
Shield vulnerable students
In this method, districts receive no cuts for their vulnerable students, including low-income students, English learners, students with disabilities and students experiencing homelessness or in foster care. This is one of many methods that state leaders can use to ensure that high-needs districts are protected from disproportionate budget cuts.
How it works:
No cuts for the number of vulnerable students in the district.
Formula: Cut x Number of Students with No Additional Needs = Total Cut
Fair funding analysis:
Most equitable – Highest-poverty districts receive smaller cuts, $616 less per pupil on average, compared to the wealthiest districts.
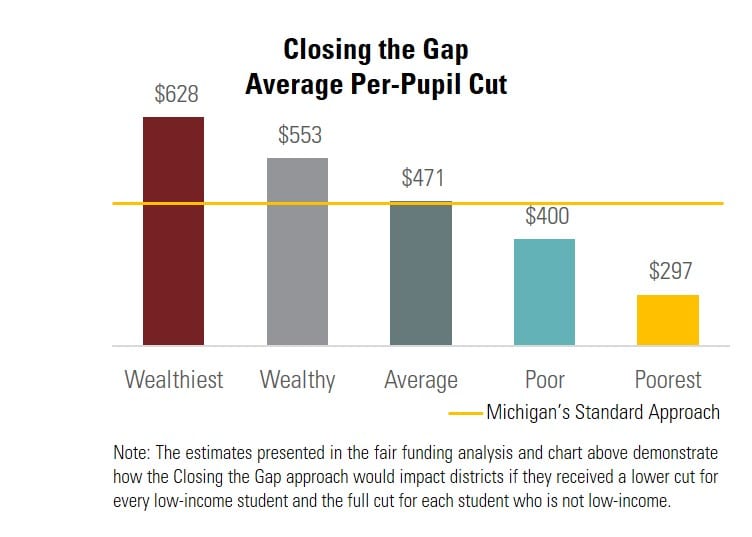
Closing the Gap
Closing the gap for vulnerable students
This method works toward closing the funding gap for vulnerable students by shielding them from the harshest cuts. Districts receive a lower cut for every student with additional needs. Preserving most of the funding for students in need is one way to lessen the harmful impact of budget cuts on vulnerable students.
How it works:
Vulnerable students are shielded from the harshest cuts. For example, districts receive a lower cut for every low-income student compared to the cut for wealthier students.
Formula: [Lower Cut x Number of Students with Additional Needs] + [Full Cut x Number of Students with No Additional Needs] = Total Cut
Fair funding analysis:
More equitable – Highest-poverty districts receive smaller cuts, $331 less per pupil on average, compared to the wealthiest districts.
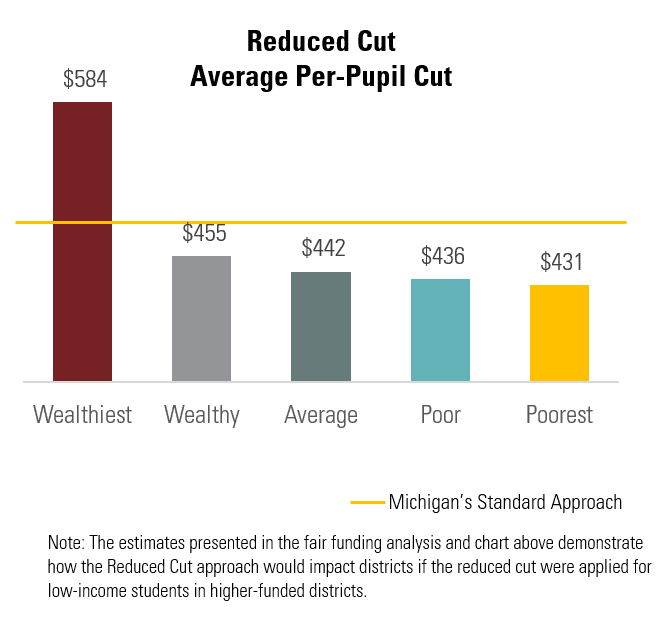
Reduced Cut
Cut in proportion to funding level and student need
This method reduces cuts for districts at the lowest funding level and for vulnerable students in higher-funded districts, resulting in reduced cuts for working-class and high-poverty districts on average.
How it works:
Reduces cuts for working-class and high-poverty districts at the lowest funding level, while also reducing cuts for vulnerable students in higher-funded districts.
Formula – Lowest-funded districts:
Reduced Cut x Number of Students = Total Cut
Formula – Higher-funded districts:
[Cut based on higher foundation allowance level x Number of Students with No Additional Needs] +
[Reduced Cut x Number of Students with Additional Needs] = Total Cut
Fair funding analysis:
More equitable – Poorest districts receive smaller cuts, $154 less per pupil on average, compared to the wealthiest districts. Low-income students in higher-funded districts are shielded from the higher cuts.
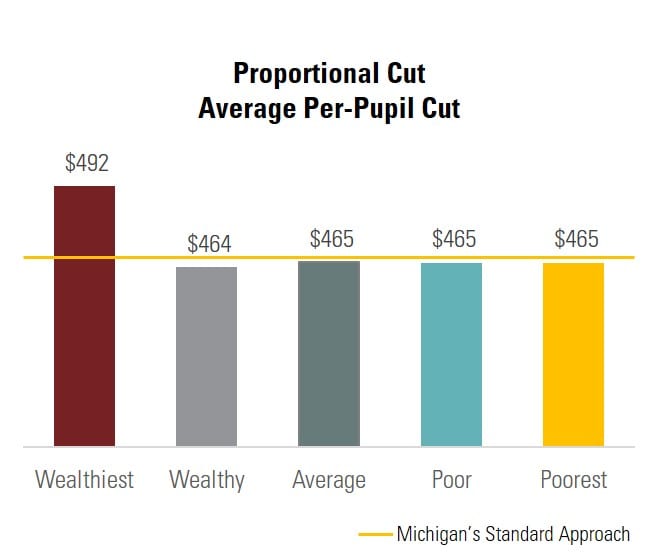
Proportional Cut
Cut same percentage for every student
In this method, per-pupil funding is reduced by the same percentage in each district. This model accounts for district funding levels but not student need.
How it works:
Per-pupil funding is reduced by the same percentage for every student.
Formula: Same Percentage Cut (e.g 5.64%) of Total Per-Pupil Funding = Total Cut
Fair funding analysis:
More equitable – Highest-poverty districts receive smaller cuts, $27 less per pupil on average, compared to the wealthiest districts.
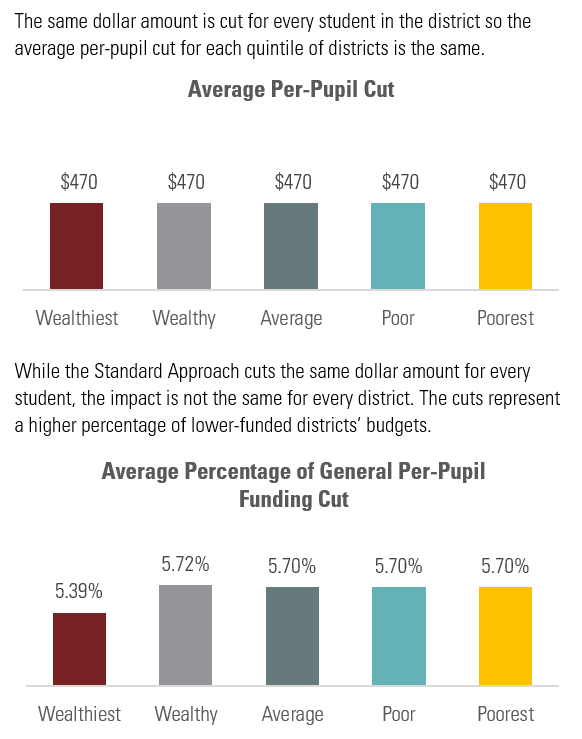
Standard Approach: Uniform Dollar Cut
Cut same amount for every student
This method cuts the same amount for every student enrolled — which treats students equally. But we know that no two students are the same and some students need more resources. In addition, many of the same communities and districts that have been historically underserved have also been disproportionately impacted by the coronavirus pandemic. We should not treat students, schools and districts with additional needs the same as others.
How it works:
The same dollar amount is cut for every student the district enrolls. This model does not account for students’ needs.
Formula: Same Cut (e.g. $470) x Number of Students = Total Cut
Fair funding analysis:
Not equitable – Districts with fewer resources, especially those with more students in poverty, are disproportionately impacted.